Walkability & the 10-minute transit network in the Waterloo Region
The Waterloo Region in Southern Ontario has some of the highest quality municipal-level open data in the country. At least from what I’ve seen! Being based in Metro Vancouver in British Columbia, cohesive regional data is often a pipe dream with Metro Vancouver having a staggering 21 municipalities for a region of (just) 2.463 million. A mid-sized city by most accounts, and certainly a small city compared to most of the world’s heavily urbanised areas, it won’t take long for a data analyst to quickly stumble upon a seemingly arbitrary wall where the dataset just stops. So what’s the situation like in other parts of the country and why not look at the region that’s supposed to be one of Canada’s high tech gems - the urban area surrounding the cities of Waterloo, Kitchener and Cambridge in Southern Ontario?
So here’s an explorative question: How easy is it to be within walking distance (5 minutes as sufficient and 10 minutes at worst) to the Waterloo Region’s most frequent transit services? In this case, we’re interested in their express buses (iXpress) and light rail services (ION). A crucial point in this exploration is that I am not a resident of this region nor have I visited it for any significant amount of time. The idea here is to try evaluate a network using just data I am able to obtain publicly and see if I can make anything useful out of it while preventing resident bias from creeping in.
For this explorative study, I’ll consult just 2 sources, and use 1 basemap provider:
- The Waterloo Region’s open data portal.
- Open data as provided by the Grand River Transit system (GRT), the main transit operator in the region.
- A basemap provided by OpenStreetMap.
Analysis
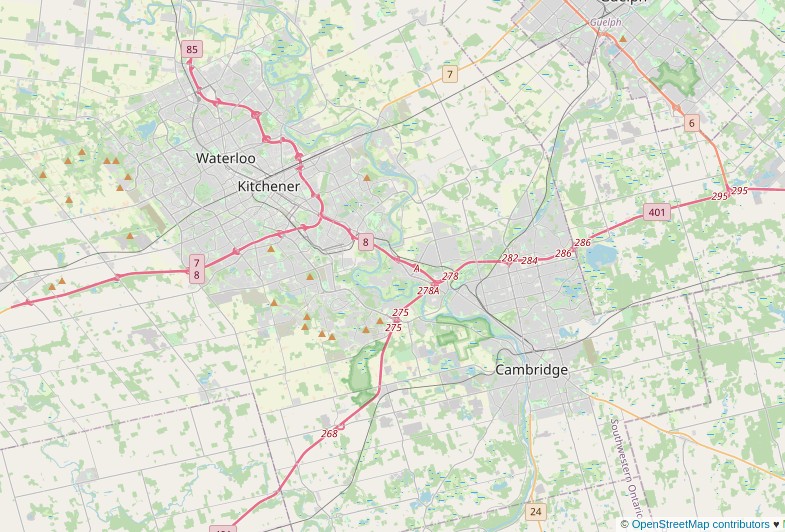
Here’s a basemap of the area, to give some geographical context.
We need to model the existing road network across the region. Luckily, this is available in a single shapefile:
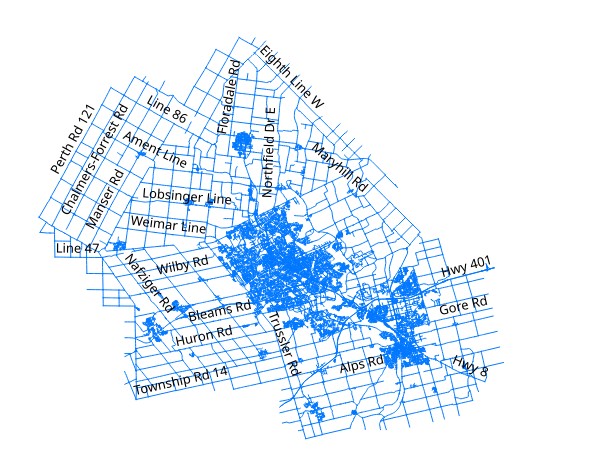
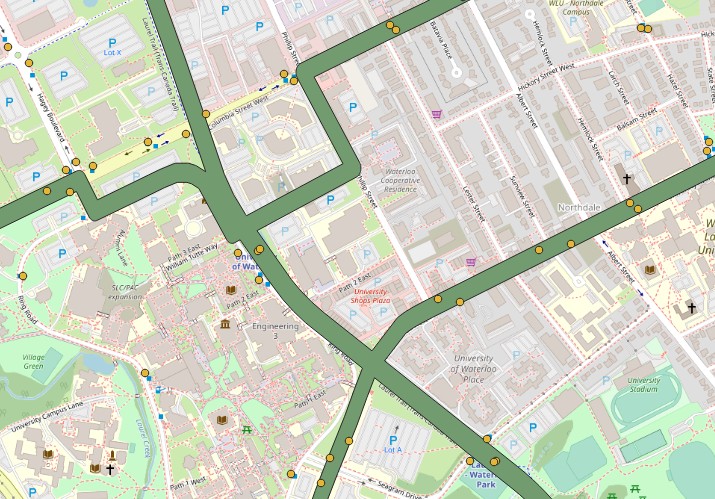
Waterloo Region road network
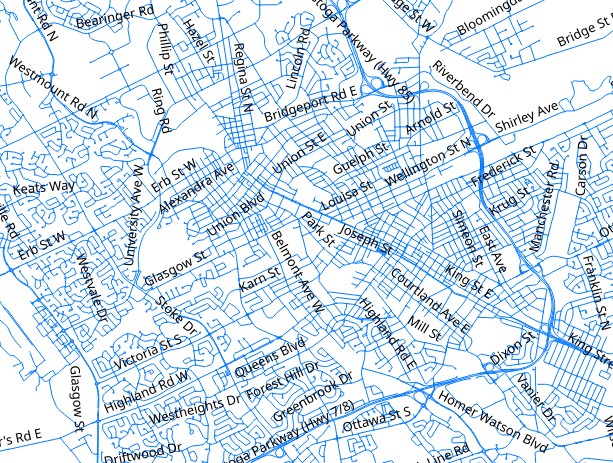
The same file, zoomed into uptown Waterloo
Next, we need to find routes for buses. GRT are good with open data and provide routes as part of their public data offerings here. The master file contains a list of all transit routes. However, we are just interested in their frequent service, as defined by having a 10 minutes frequency (ish) during weekday peak periods. Lets see if there is anything in the data to help us filter routes out:
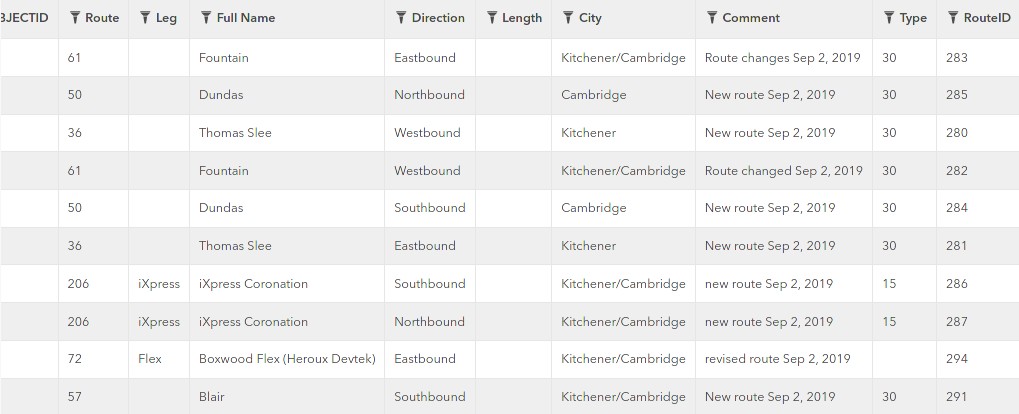
Routes specifications shapefile
I can’t find a data dictionary anywhere convenient, but the type column seems promising as it has values in 5-some discrete blocks: 5,10,15,30 etc. Looks suspiciously like time and frequency would make sense. Filtering it out using a quick pandas query, seems to show only iXpress and ION services with type 10 so that must’ve worked! We have a narrowed route spec file with just the most frequent services listed. We can lay these shapefiles on the base map and categorize each line by route number to differentiate them.
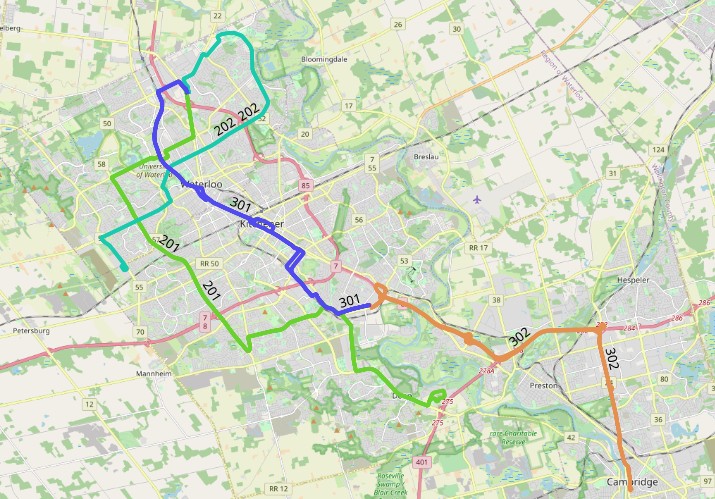
Most frequent services labelled and overlaid on the basemap
Great! However, we’re interested in distance walking to access a service. So what matters more than where these lines run is where the stops for this line are located. What good is it to watch a frequent bus zoom by your place but know that the nearest stop to access it is a kilometre away right? So we’ll take a dive through GRT’s data page again and grab another shapefile that focuses on bus/train stops (points) as opposed to routes. Here’s another snag though - the stops specification shows where the bus stop is located in space, but many bus stops have several routes passing through them. Looks like we’ll have to do some filtering using both the routes and stops files.
So, first laying out stops on the basemap (I’ve hidden routes and other shapes we don’t need at this point to keep my working file clean).
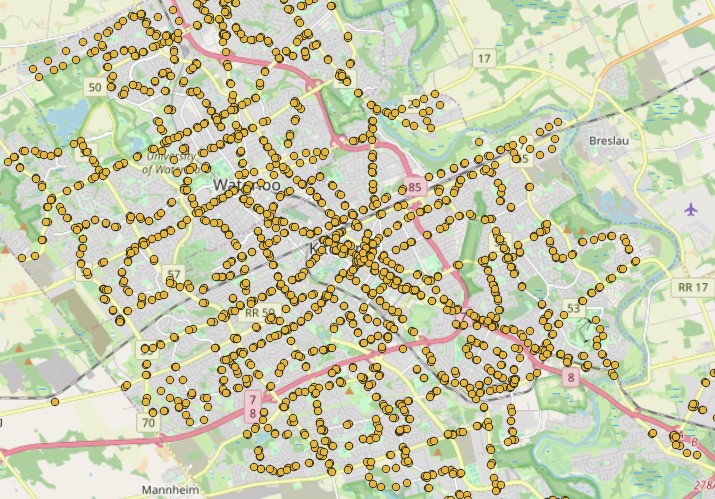
Bus stops laid out
We can now find out what subset of these stops lie in the path of our frequent bus routes from earlier on. For this, I’m just using vector geometry tools within QGIS (python based) but you could certainly try many other methods to extract a subset of these stops. Here’s another problem though: the shapefiles for routes are lines. They can be of any thickness so GIS software would not know if a line intersects a point; the line could be infinitely thick or have zero thickness. To get around this, we can create a buffer region around each route. Bus routes and road shapefiles are normally defined using the centreline of the roadway they’re on. So setting a buffer of about 10-15m on either side of the centreline should be able to cover any nearside and farside bus stops, without being so large as to go over other bus stops that are located far away. This part is an art: too small a buffer and you’ll miss bus stops. Too large a buffer and you’ll include too many so you may have to tweak this rule depending on the geographical context of where you are. 15m might actually be too small when dealing with Ontario’s 400 level highways but too much for narrow, twisting laneways in Quebec City.
Intersection of bus stops with a predefined route buffer
Notice that the buffer is now just a blob and doesn’t differentiate route numbers. We don’t really need it to, because this is already based off our selected routes file. We’re only using the buffered region as a selection tool for bus stops and it will not be present in any outputs from this process. All stops that lie outside the buffer region of our “frequent service” will be removed from the study.
Network Analysis time! Here, we can use any network analysis tool such as networkx or the built in QGIS network module to run a series of processes. In simple terms, the steps this function will take are the following:
- Pick a bus stop within our chosen area (the ones we know are relevant for frequent service
- From that point on the road network, calculate a locus of all portions on the network that are within 400m (highlight them red) and 800m (highlight them orange.
- 400m is chosen as the estimated distance covered by walking for 5 minutes. This translates to a walking speed of about 1.33 m/s. Some may walk faster, some slower and so this is just an average speed. Common speeds used by agencies range from 1 m/s to 1.5m/s.
- 800m is chosen as the estimated distance covered by walking for 10 minutes, same process as above.
- Move on to the next bus stop and repeat. Doing this across the entire network and overlapping segments as necessary.
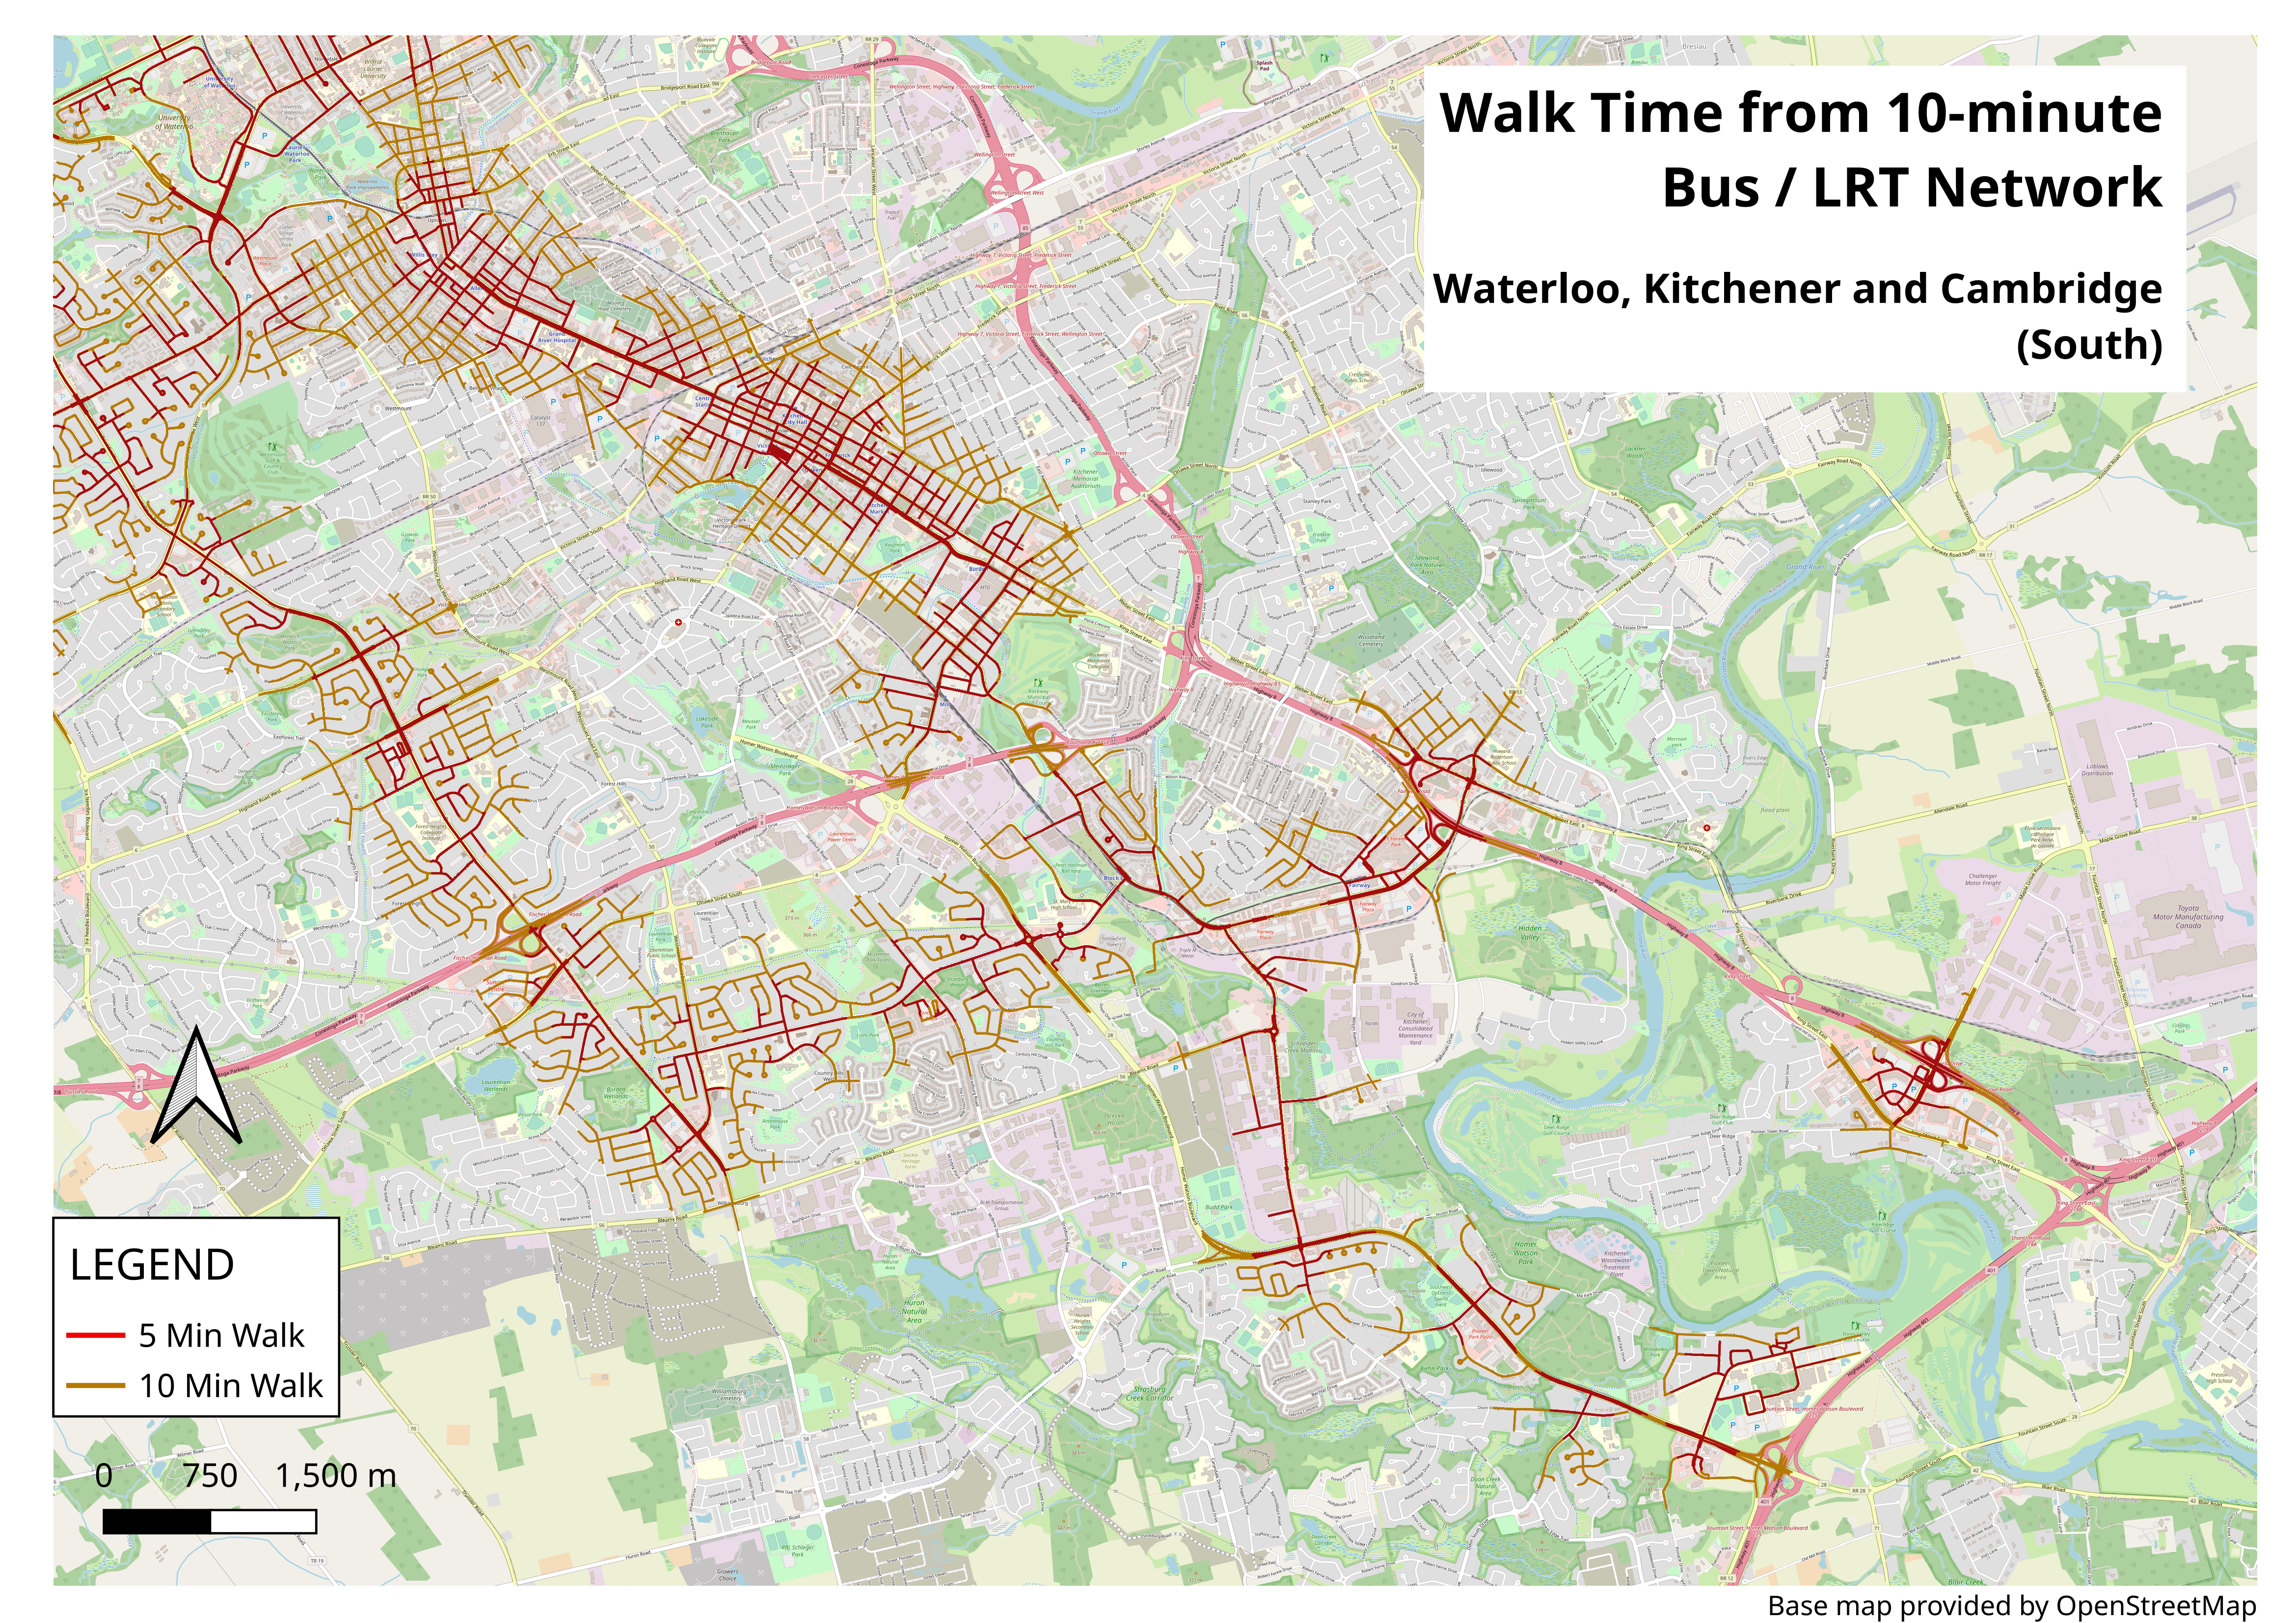
The result is a kind of heatmap that shows you segments in red, where you’re 5 upto minutes walk away from a frequent service stop; segments in orange, where you’re between 5 and 10 minutes walk away from a frequent service stop and unmarked otherwise. Here are some examples of the network we get:
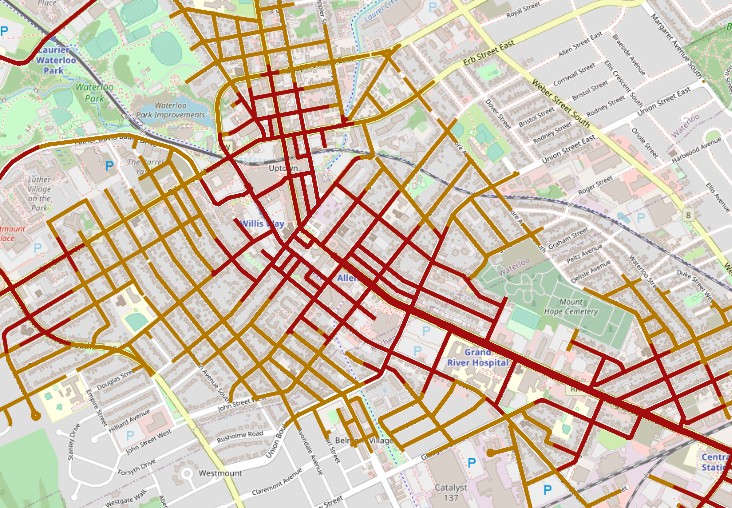
A sample showing Uptown Waterloo, with excellent connectivity to frequent transit.
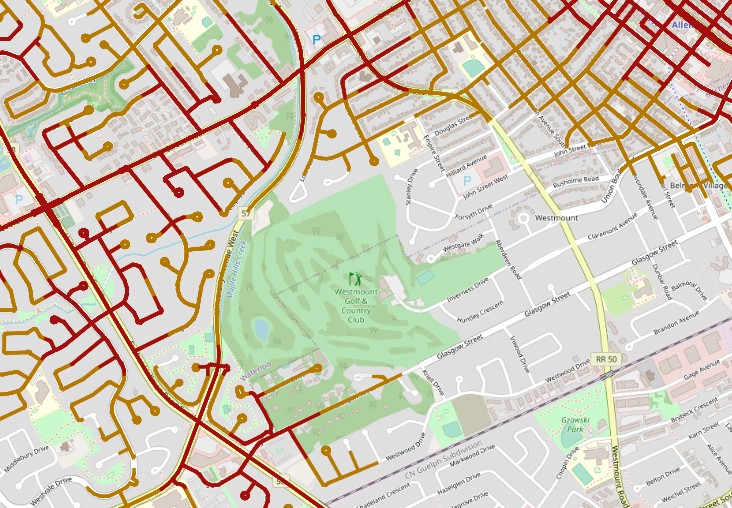
A sample showing a shift in frequent transit availability, with different land uses.
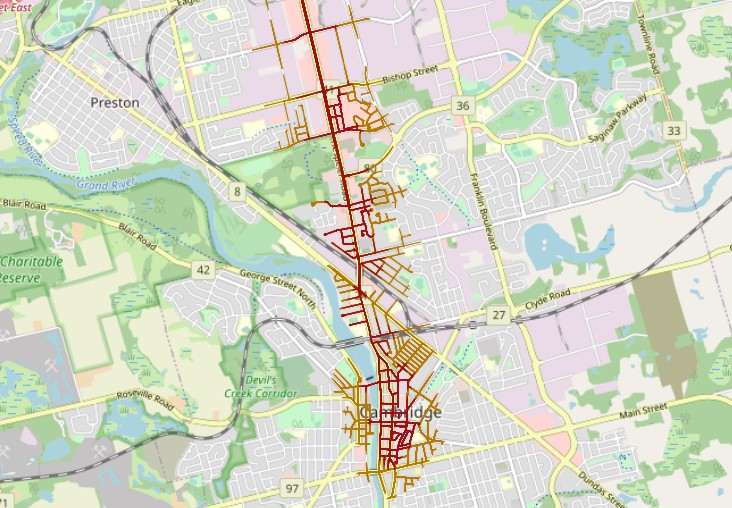
A sample showing strong linear connectivity within the city of Cambridge.
Posters and a word of caution
Yes, there are large format posters available showing this analysis for your perusal. A word of caution though: Transit planners and other professionals do this for a living at transit agencies and the reality is likely to be far more nuanced than any map I can hack together using open data and a free weekend. The maps shown here can probably show you 80% of the situation but the final 20% is where the real money lies, so the intent here is not to perform a transit network evaluation. Instead, use these at your own leisure to maybe pick a nice park for a meetup, cross-check the location of a place you want to rent or just get fascinated with how a city or metropolitan area is wired together. Heck, use it as wall art if you’d like. The GRT and Waterloo region is obviously a home to some bright minds making a region move. So if anything, let this be an appreciation into what makes a city move.
Break a leg! Low resolution posters (right click and view image for full size). Links to high resolution posters follow.
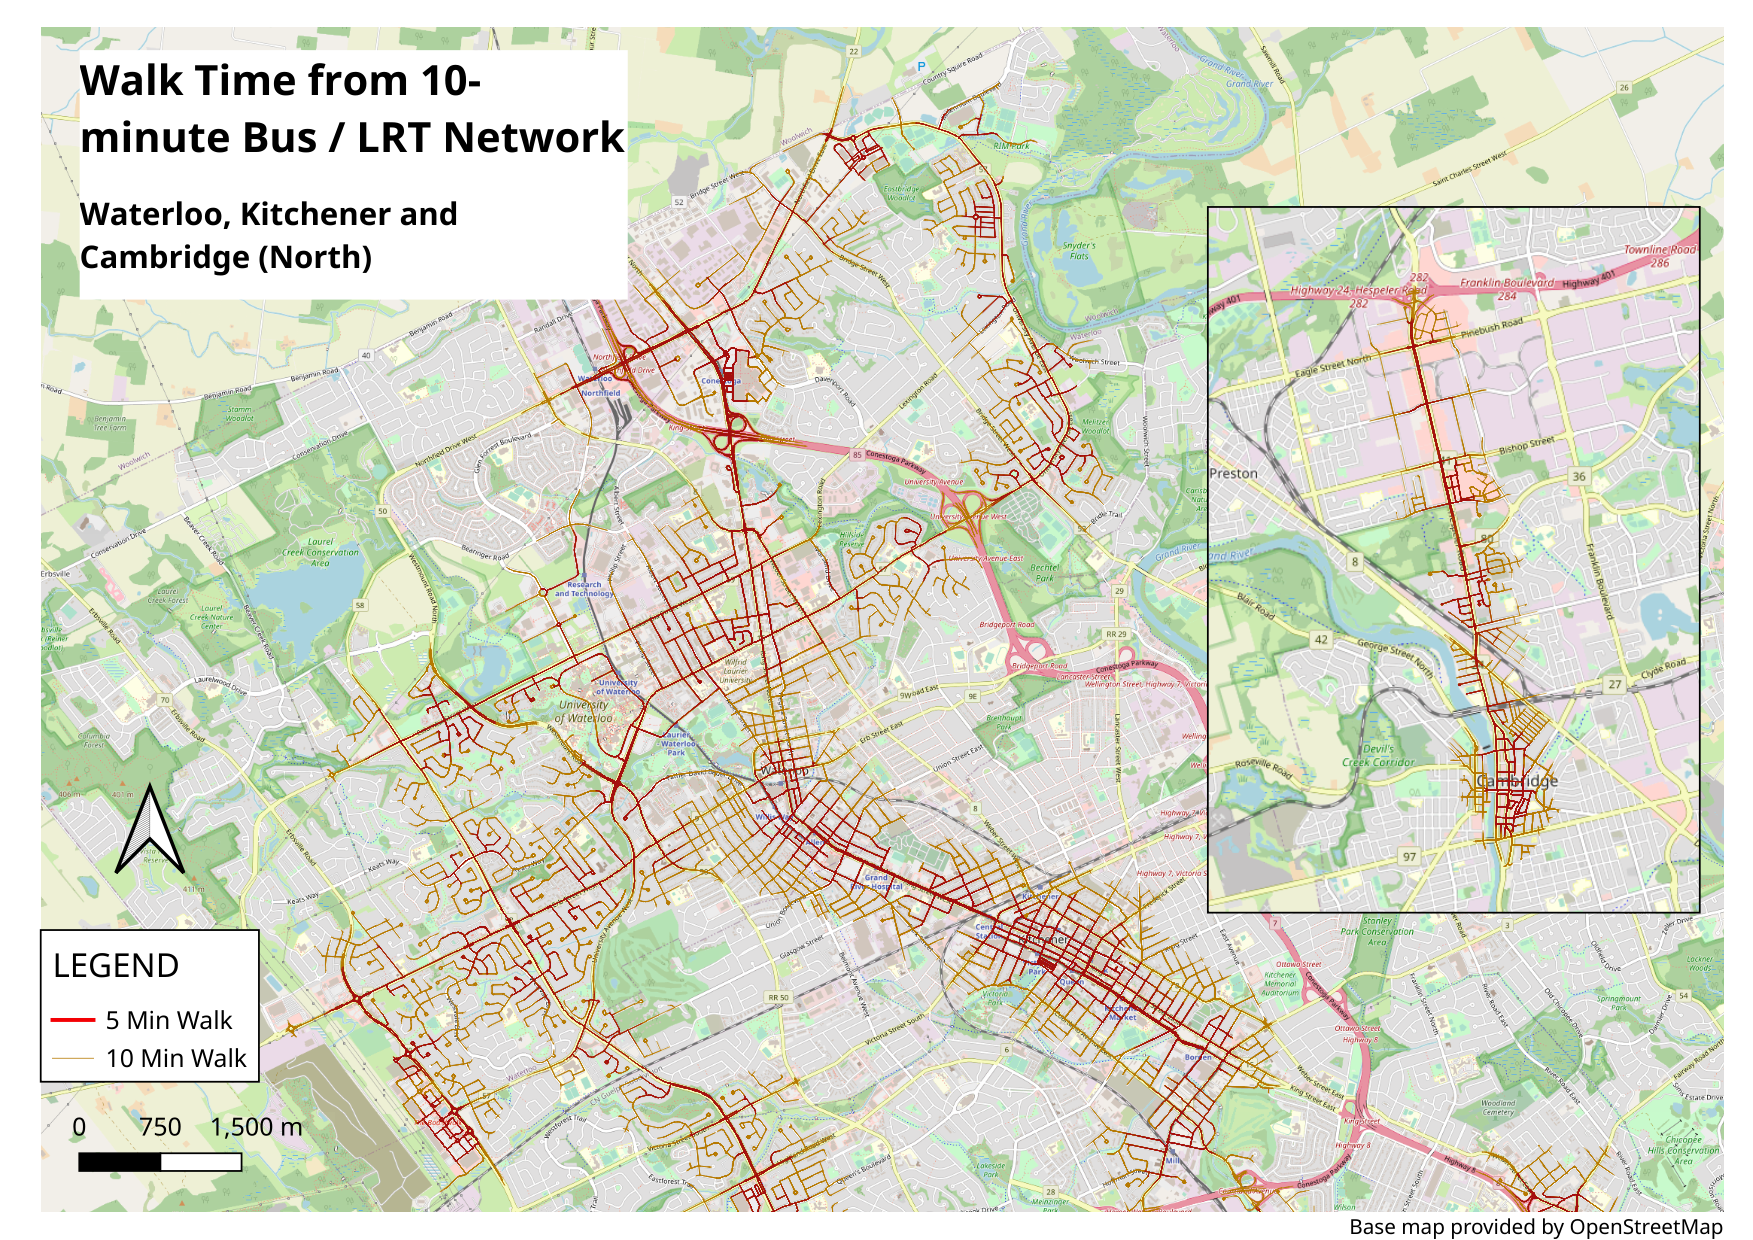
High resolution poster, Waterloo Region (North)
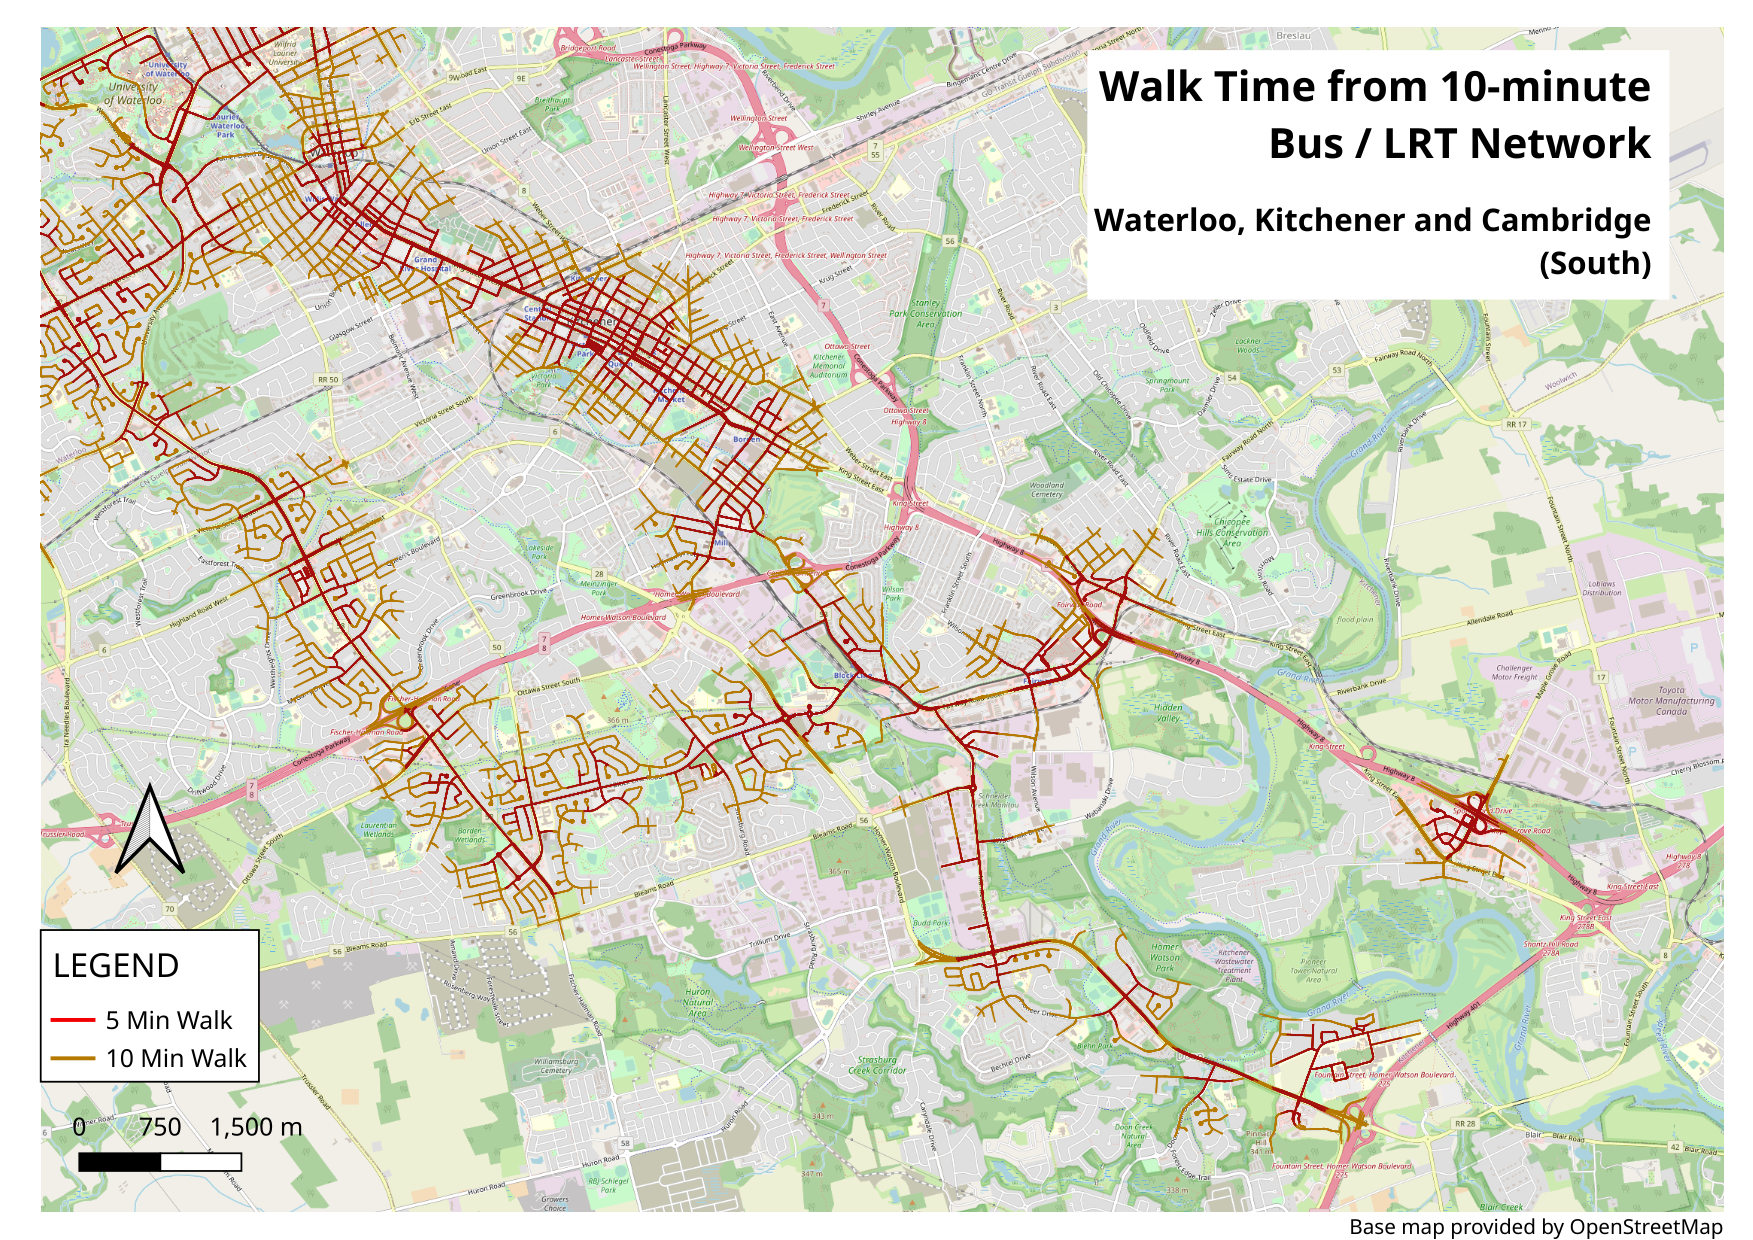
High resolution poster, Waterloo Region (South)
Warning - these are big files. Printed out, they would measure about 1.5m in width. All posters have the same licensing as content on this website.